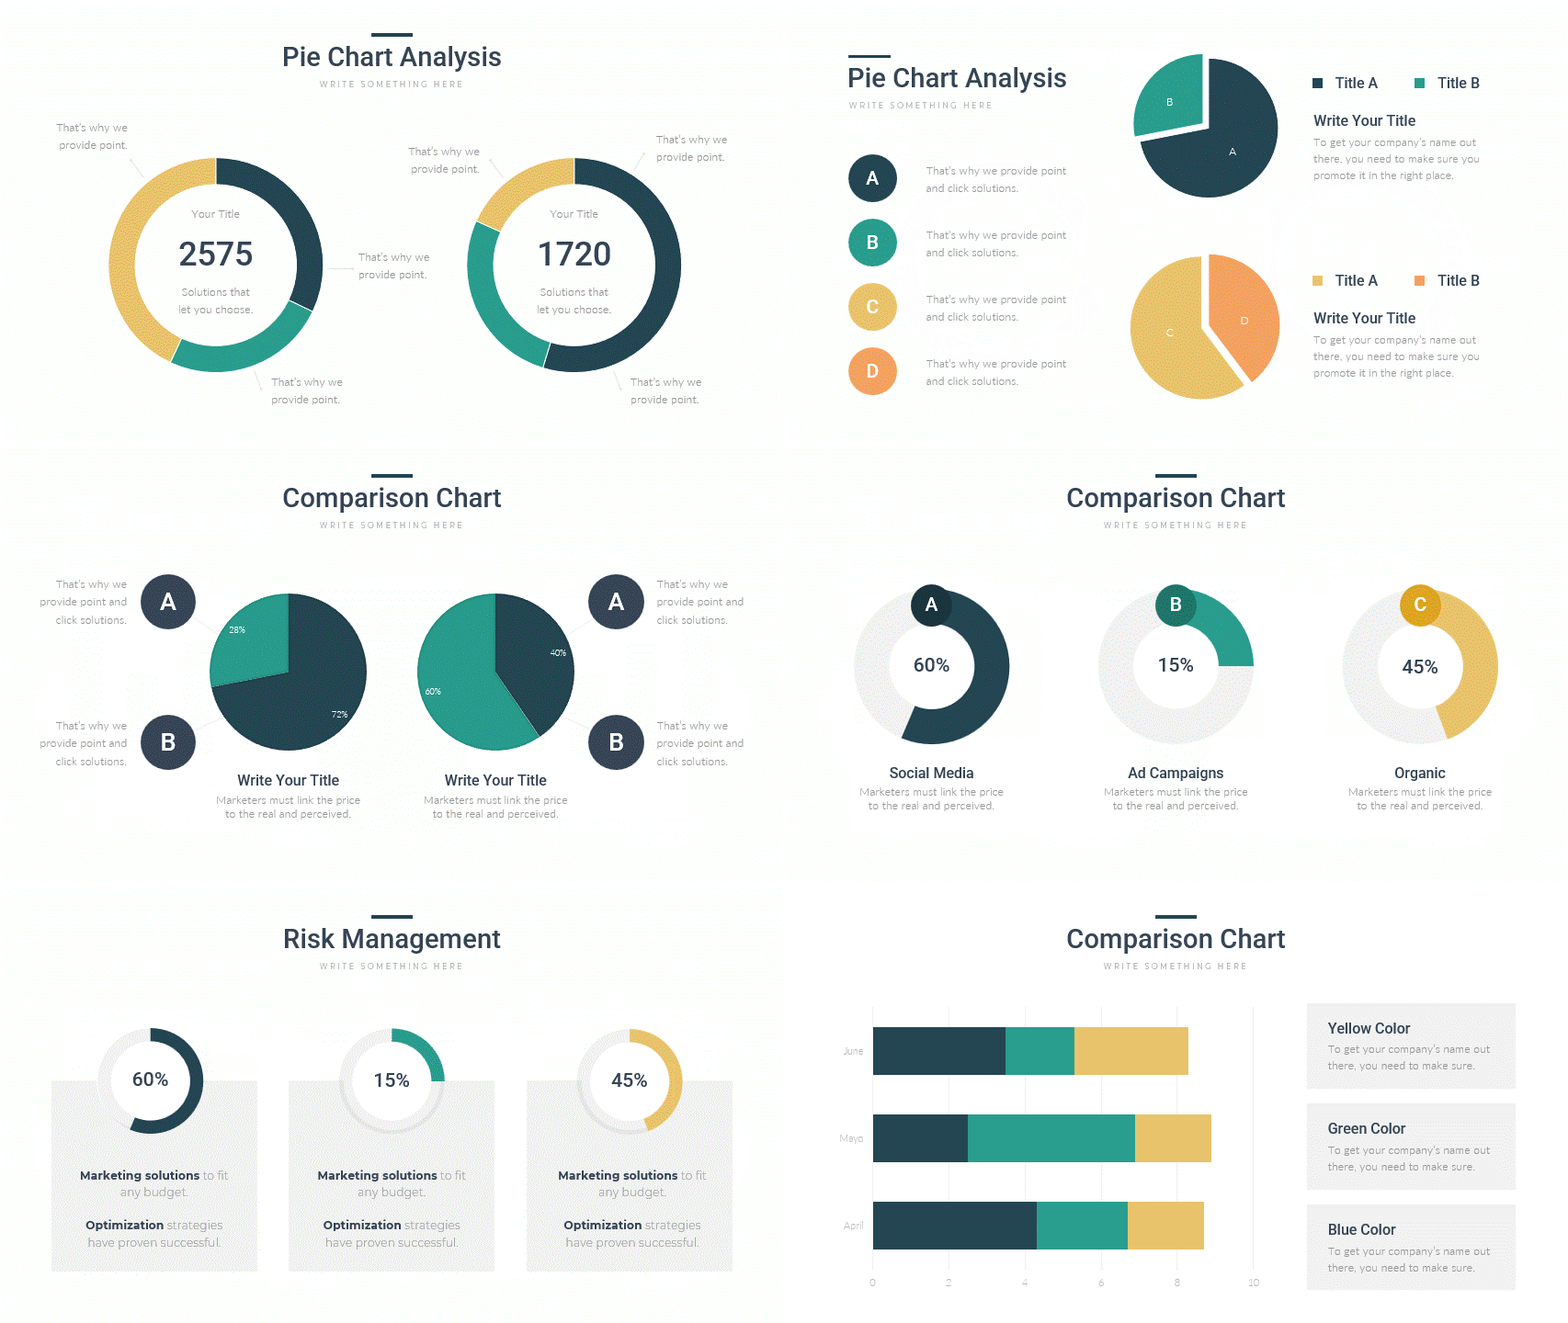
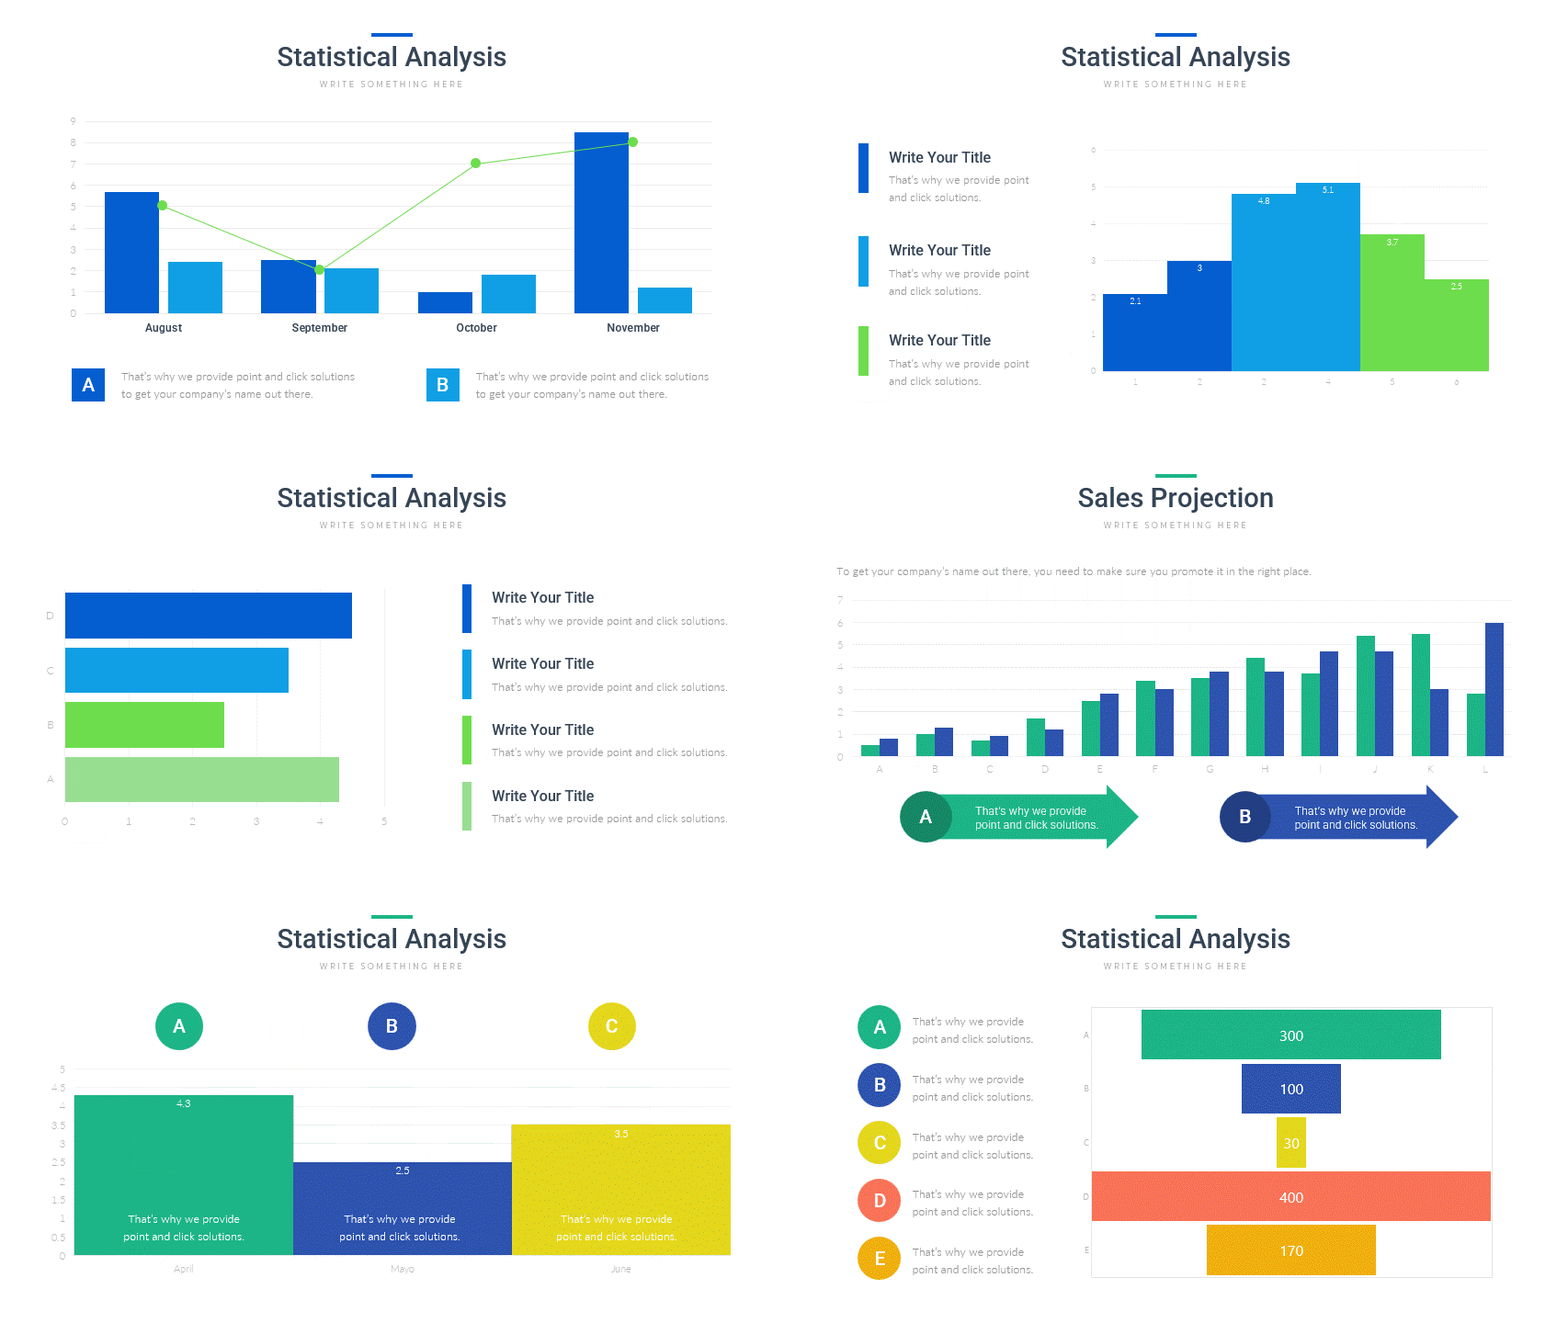
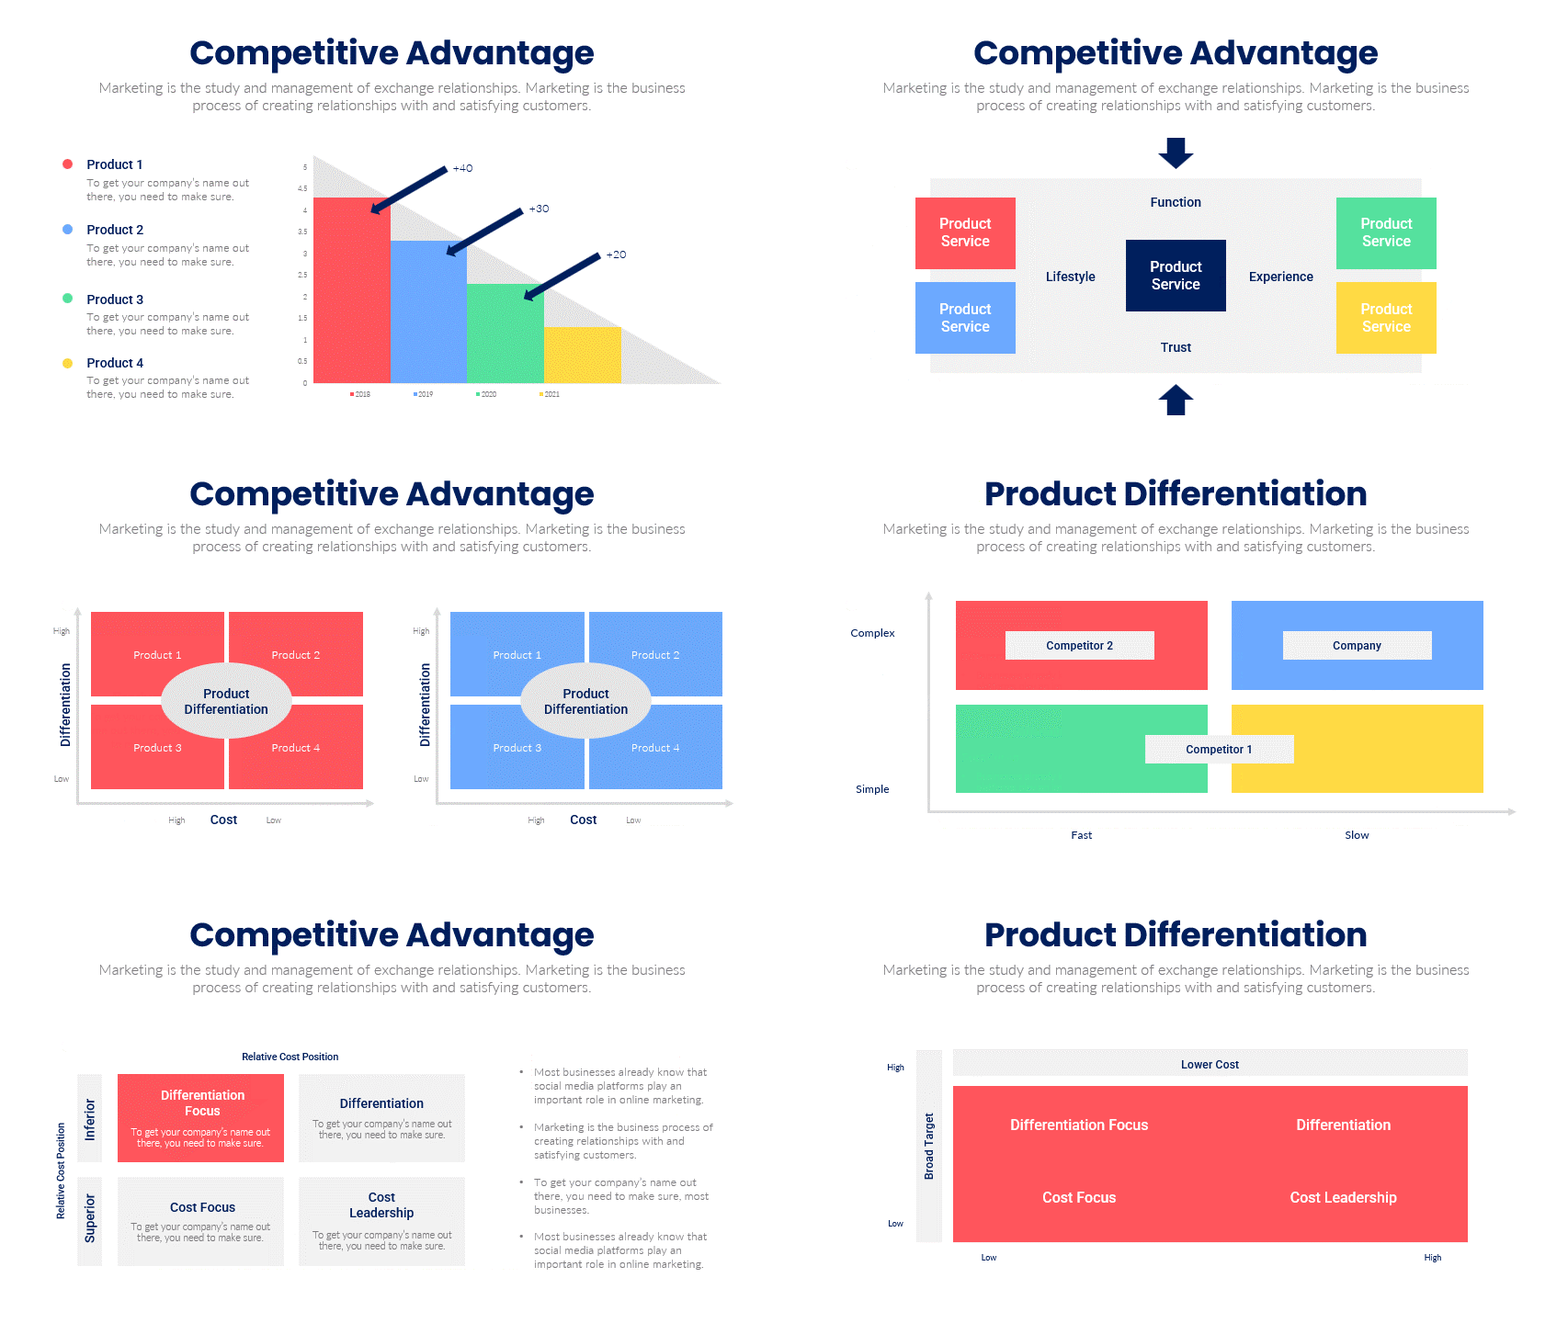
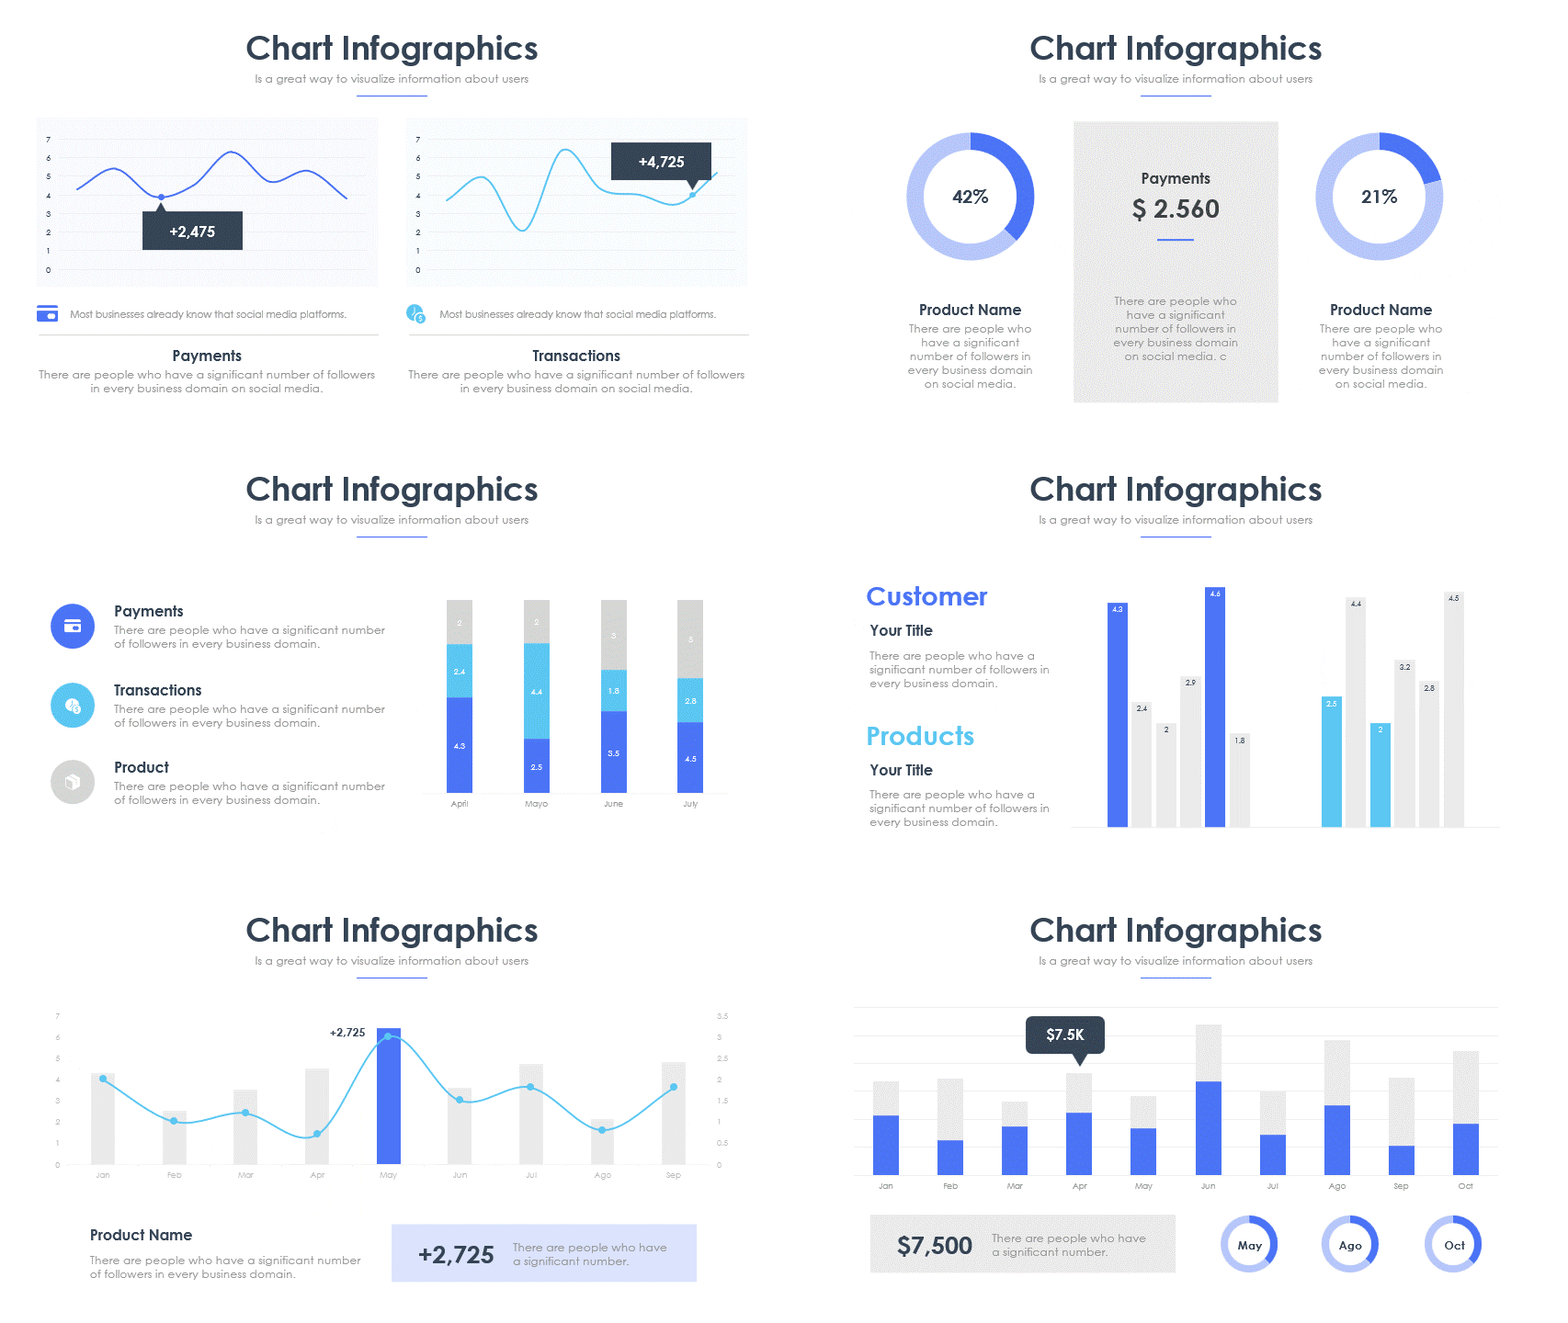
Whenever you are working with market study, business viability study or any other assessment of two subject cases, you will need comparison charts to show findings. Now, these comparison charts can be of pie charts, line graph, bar graph, bubble chart, timeline etc. Depending upon the nature and type of data set, selection of chart differs. This is a collection of 20 comparison charts Infographic slide design. These design comes with editable data table via Excel embedded in the slide.
You can use Comparison Charts Infographic Slides to showcase information in a visually appealing manner in your presentation. This is useful for business MIS, pitch deck, MBA thesis summary, Audit board summary, Market study report, product study report etc.
Elevate your information delivery capability in your presentation with the help of Comparison Chart Infographic Designs.
- All designs and layouts are fully and easily editable (shape color, size, and text).
- This template has a color theme and will automatically apply color when copied and pasted.
- Drag and drop text and image fields.
- Comes with vector icons, replaceable.
- Based on master slides
- The aspect ratio of 16:9
- Editable data field with embedded excel and spreadsheet
- It comes with 20 Comparison Chart Infographic slide designs for presentations.
- Keynote file (.key) available with the package that is compatible with Keynote.
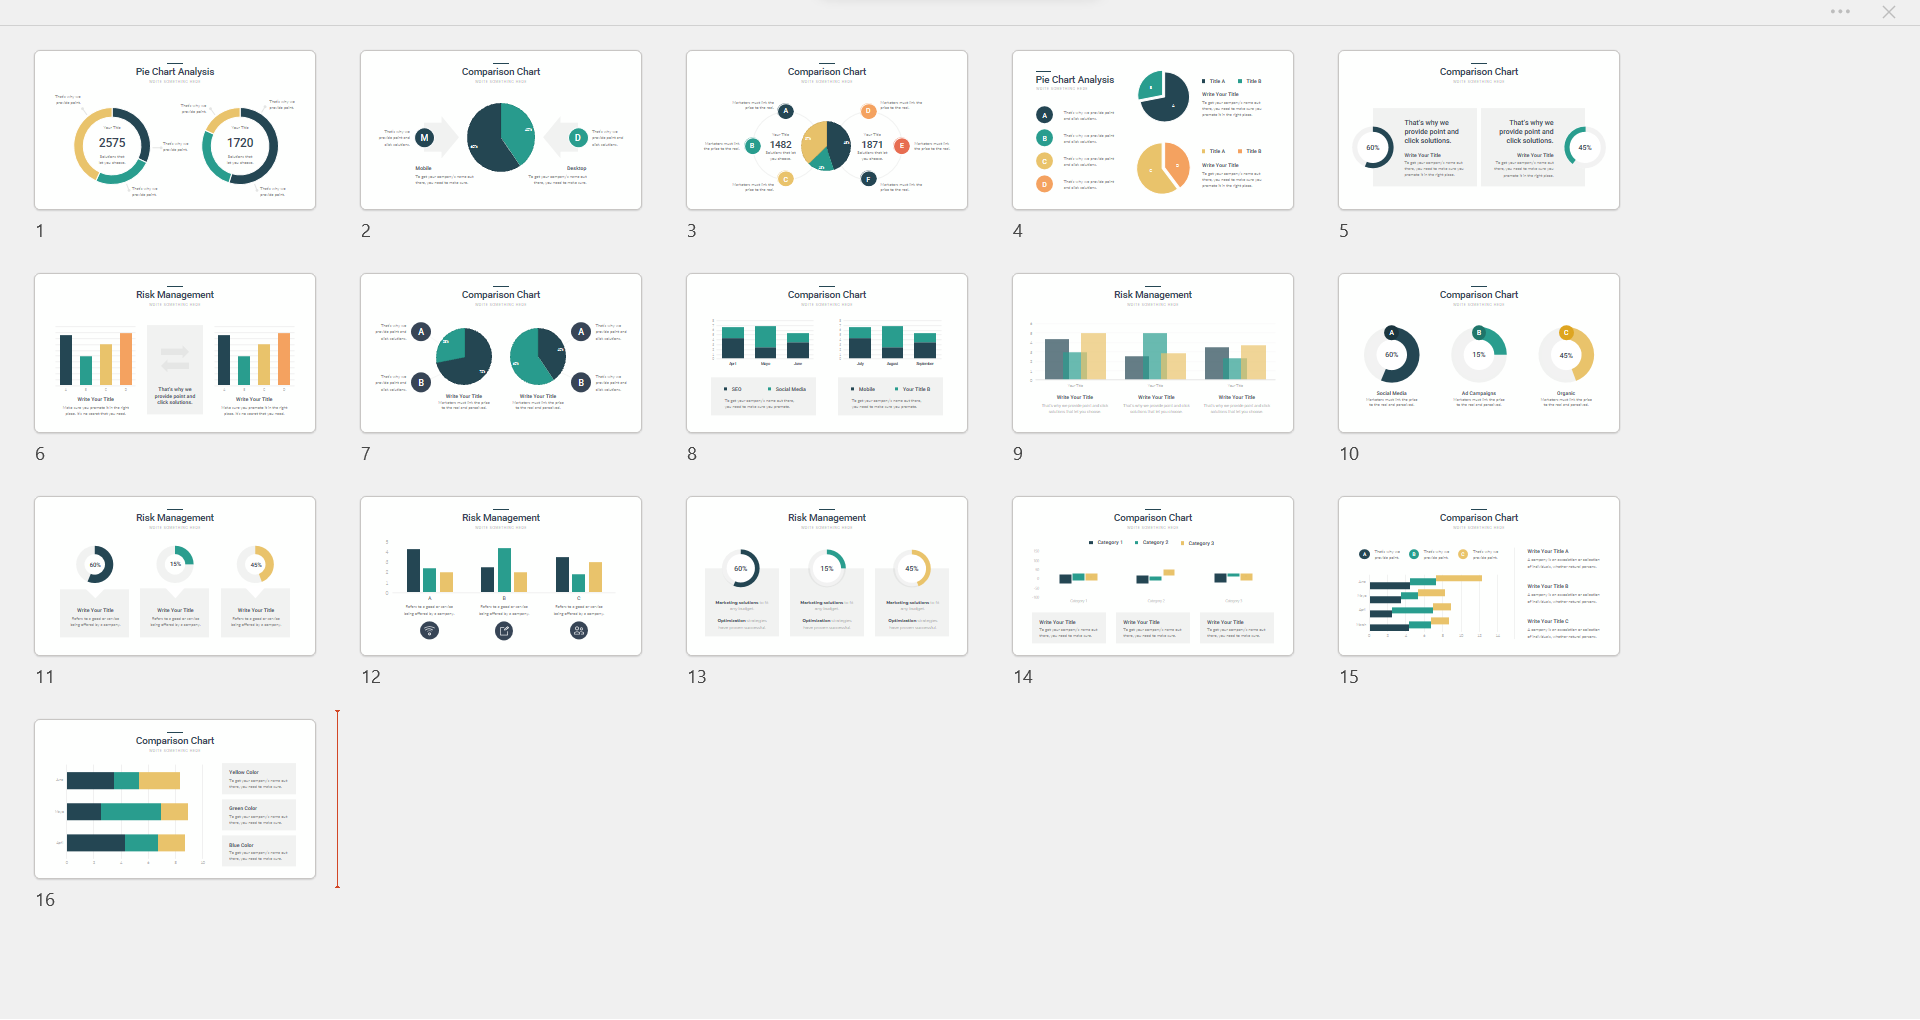
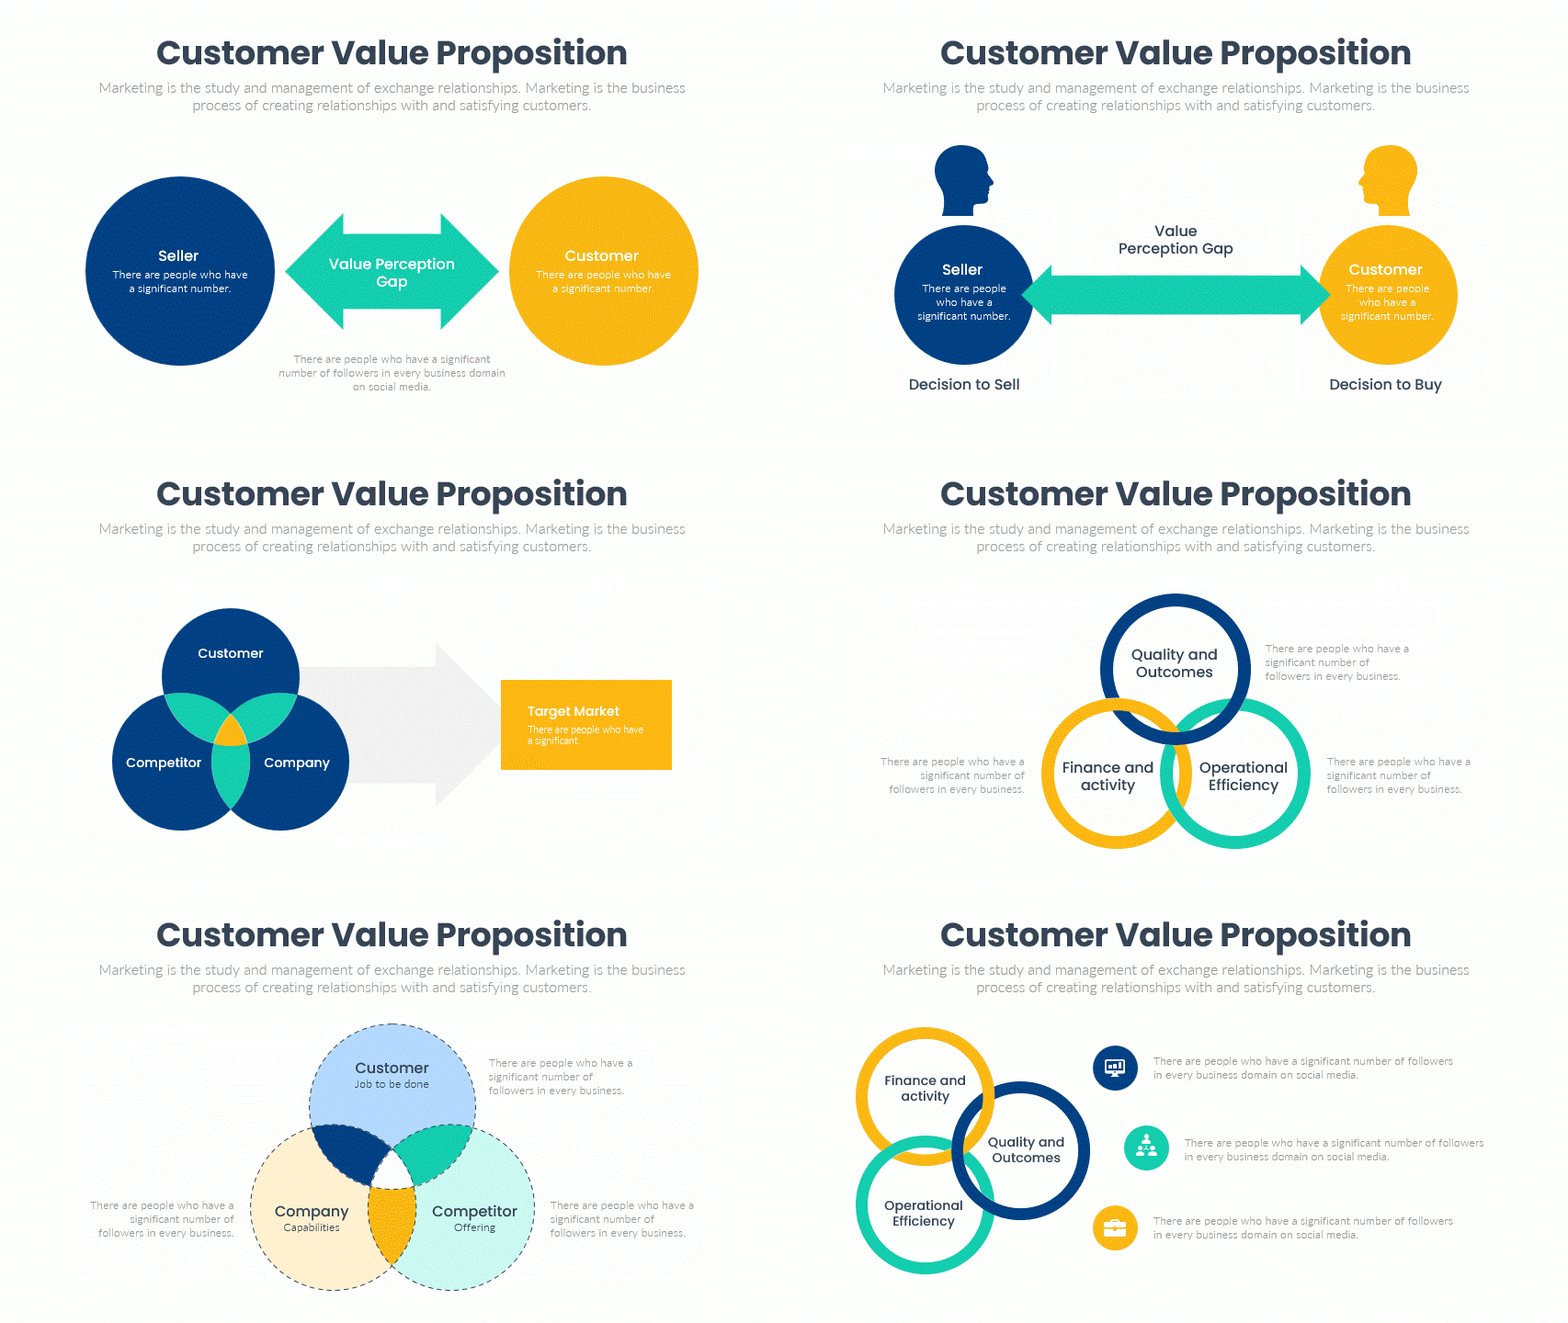
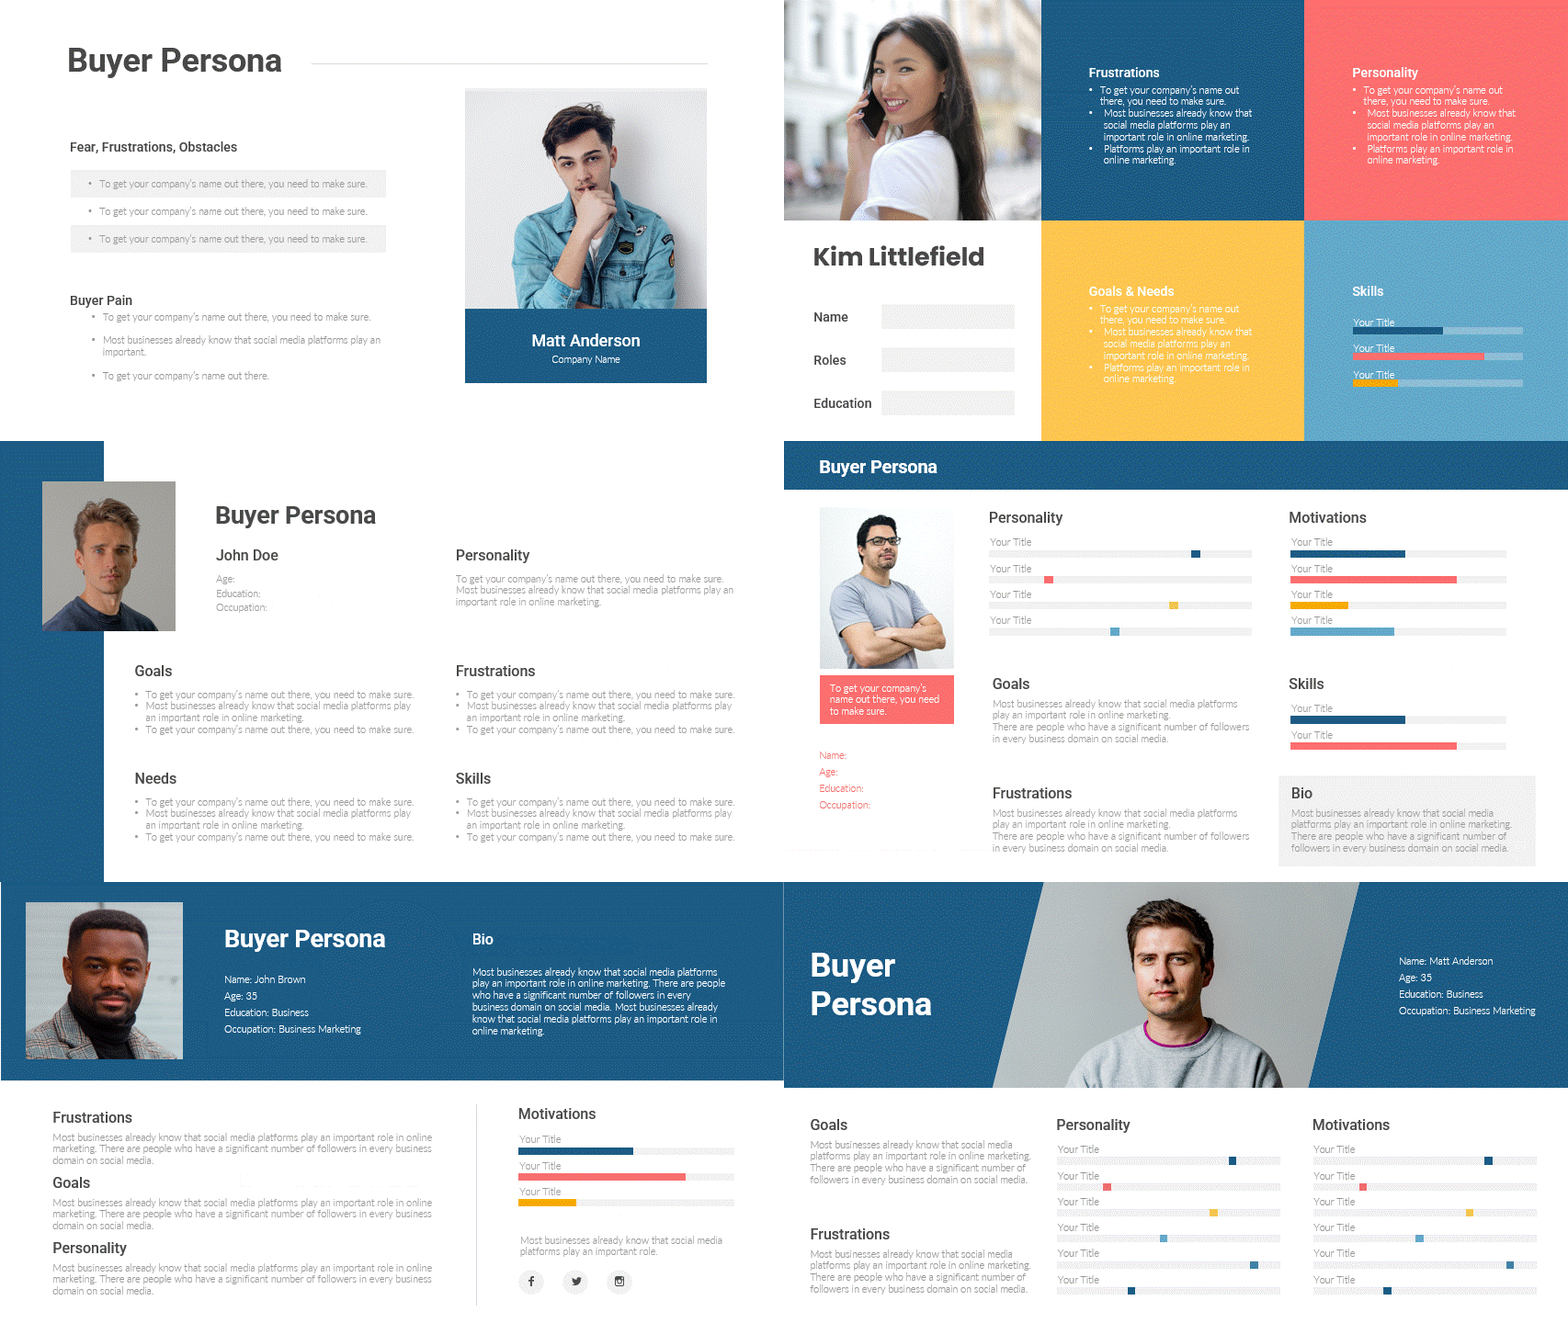
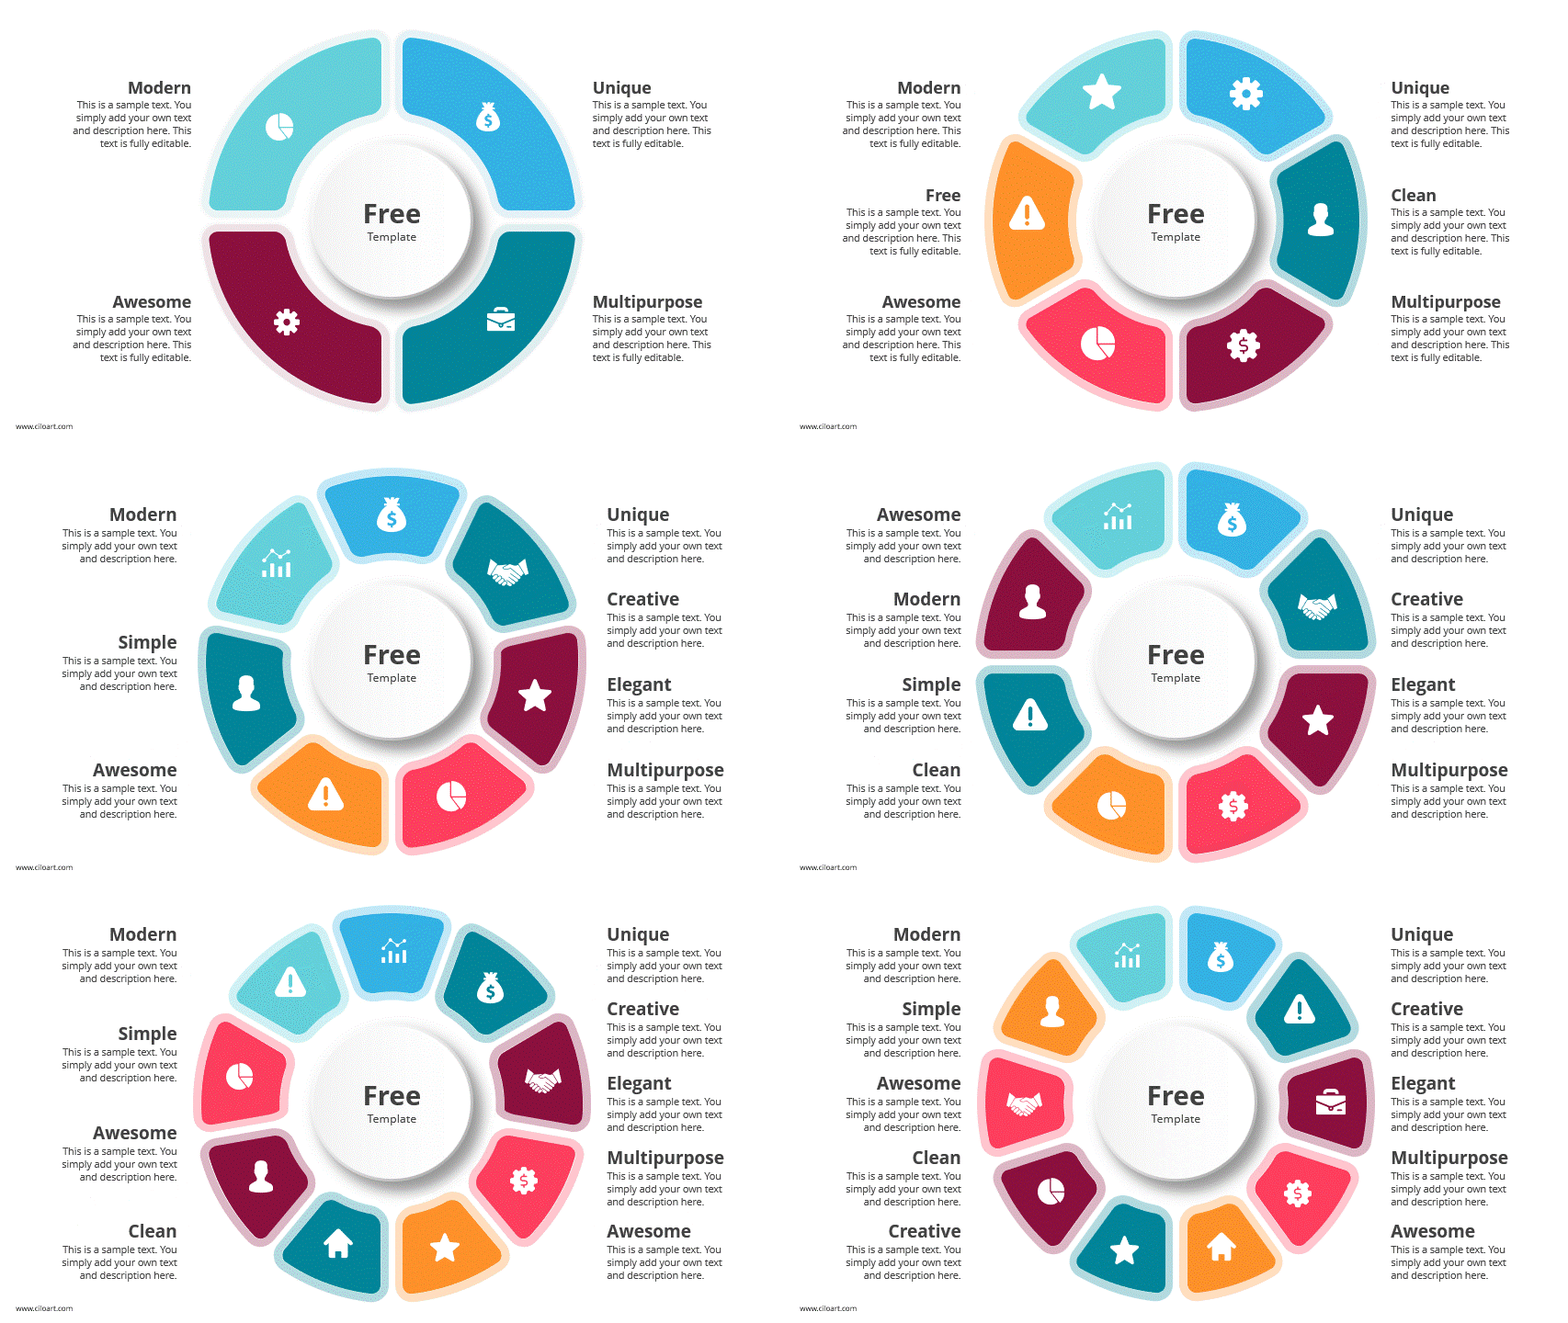
Below are the screenshot of the slides, that comes with this package. Explore and download all the resources and use / modify as per your requirement.
Customize the color scheme in the slides easily as per your requirement. Also, check out circular infographic slide designs.
