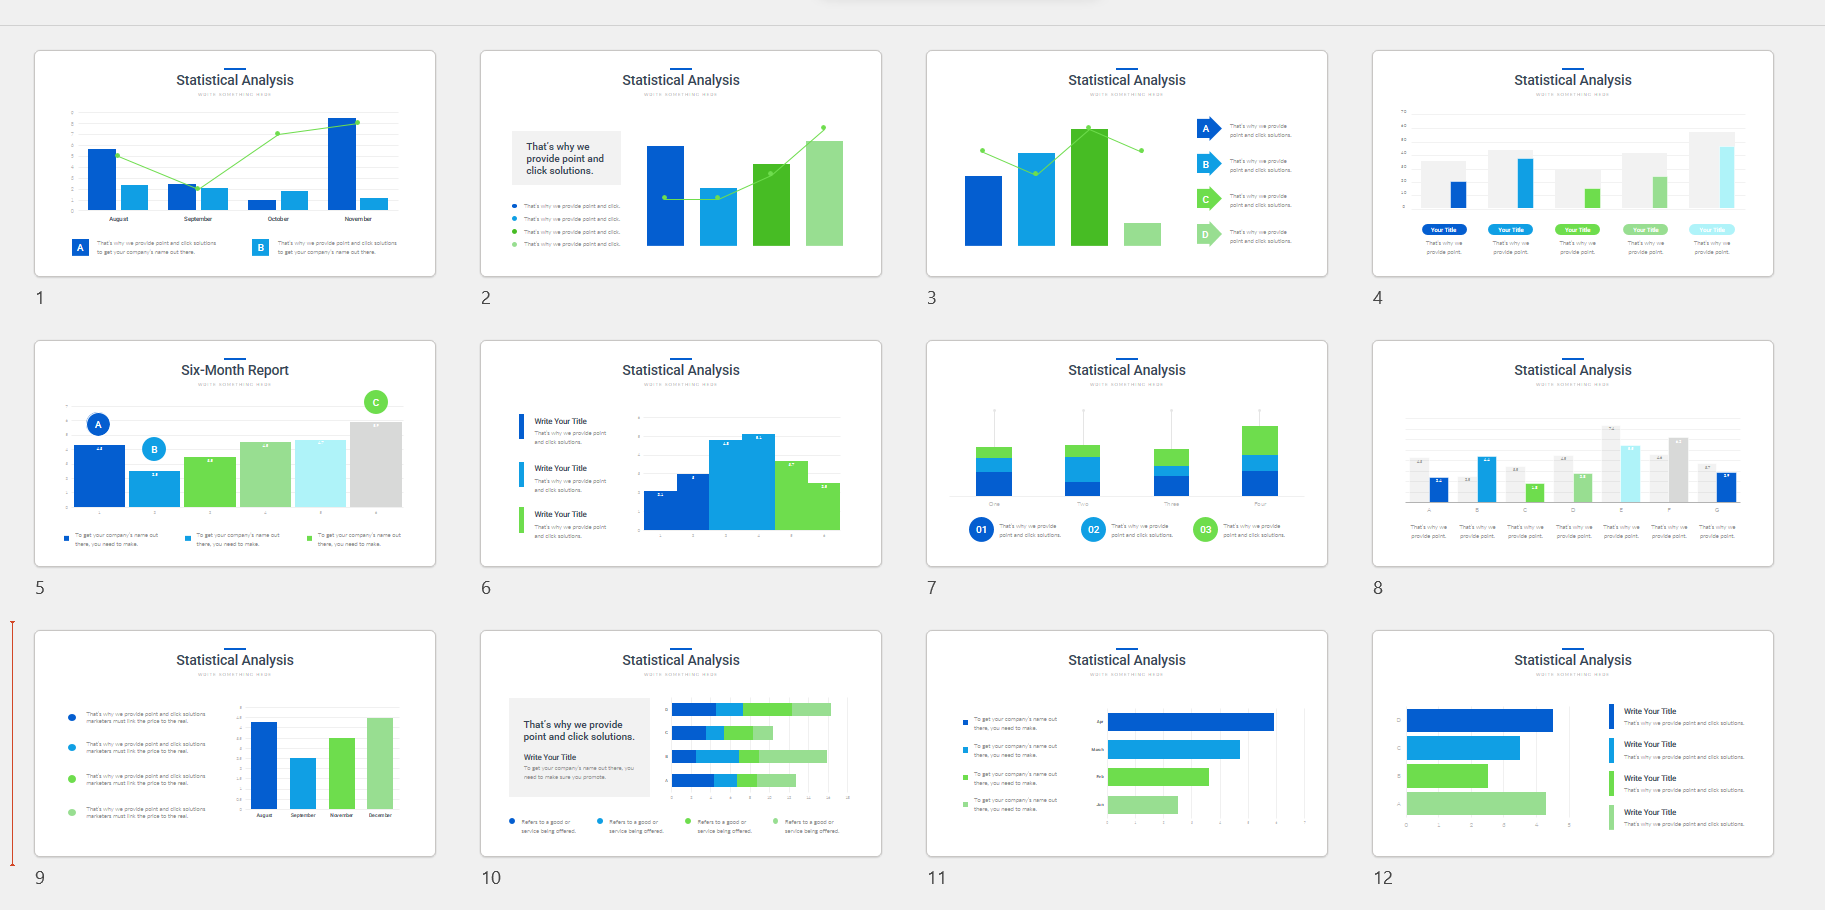
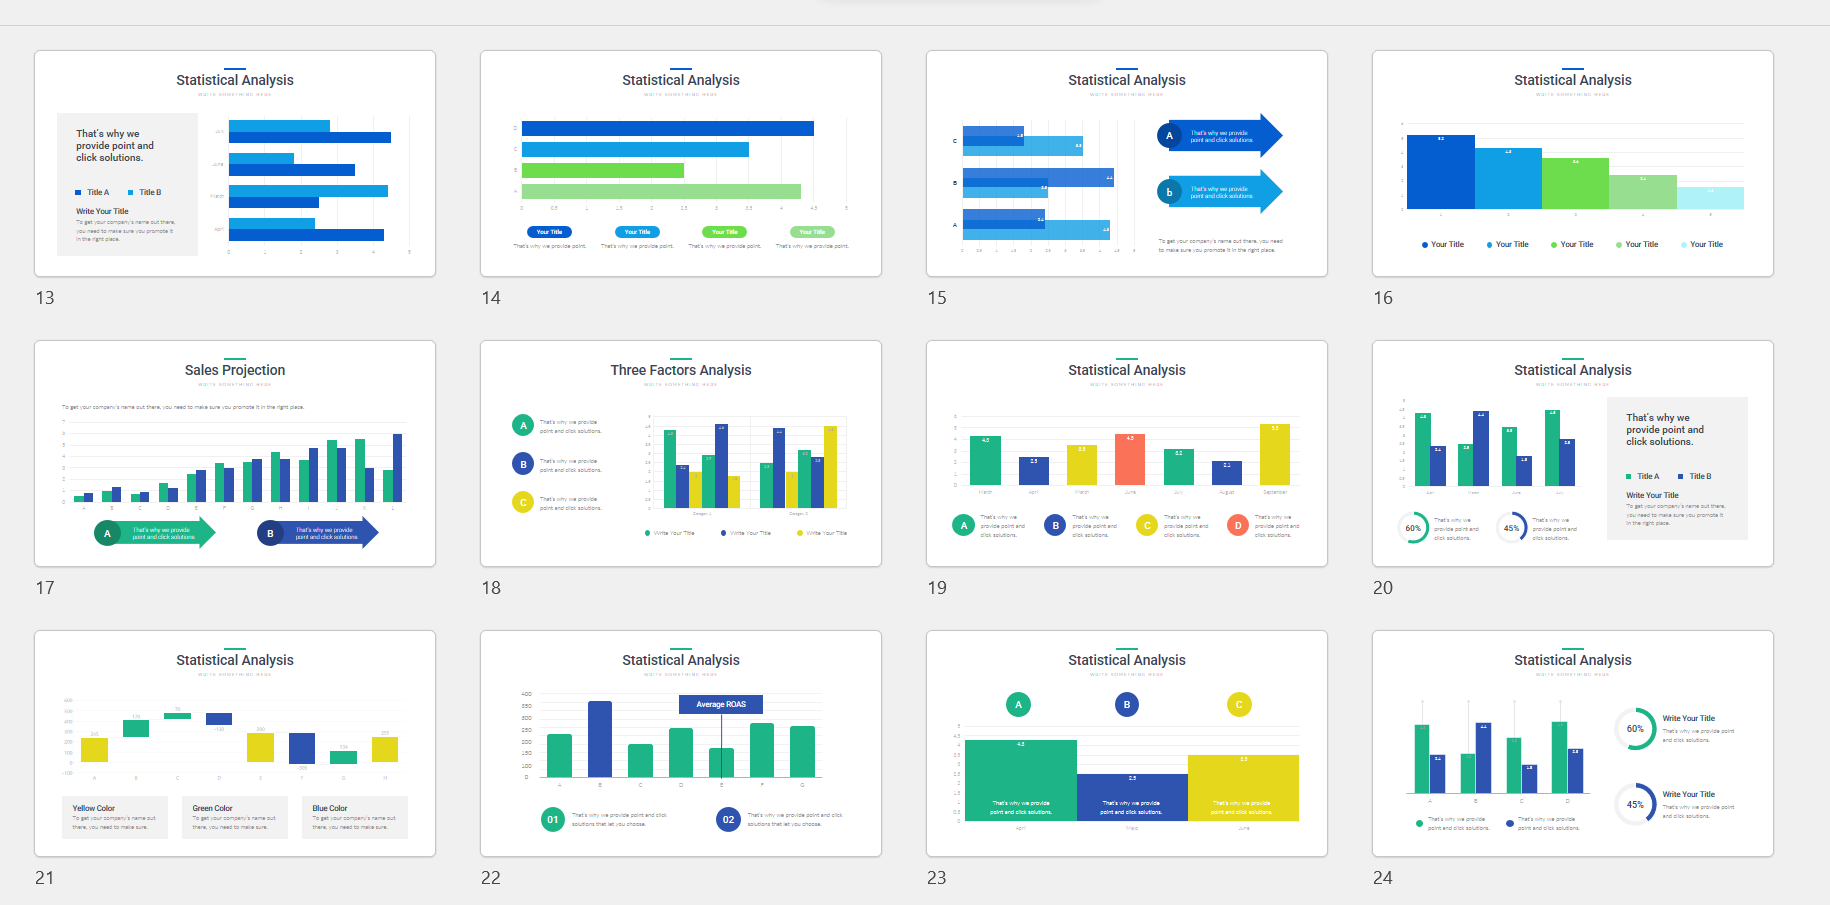
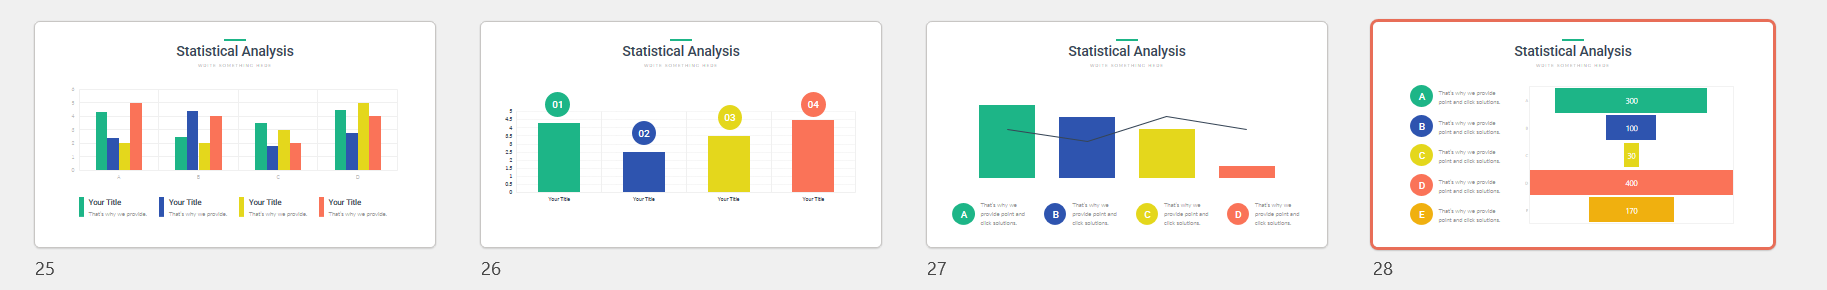
Statistical Analysis Slides is a collection of 28 different designs for bar charts, pareto analysis, funnel chart, histogram etc. useful for business presentation, marketing presentation and more. Research and study group can use these templates to visualize and present their findings in Presentations.
Thesis papers often involve various analysis and study. Your presentation can incorporate these templates to show graphs and charts.
Graphs and charts are visually more appealing than tables and data sets. You can clearly show what you intend to show using these charts and statistical analysis slides.
- All designs and layouts are fully and easily editable (shape color, size, and text).
- This template has a color theme and will automatically apply color when copied and pasted.
- Drag and drop text and image fields.
- Comes with vector icons, replaceable.
- Based on master slides
- The aspect ratio of 16:9
- It comes with 28 statistical analysis infographic slide designs for presentations.
Below are the screenshot of the slides, that comes with this package. Explore and download all the resources and use / modify as per your requirement.
All the charts are excel based. Hence, you can incorporate your data easily. To change the data and include your data in the graphs and charts used in these presentation templates, follow the steps below:
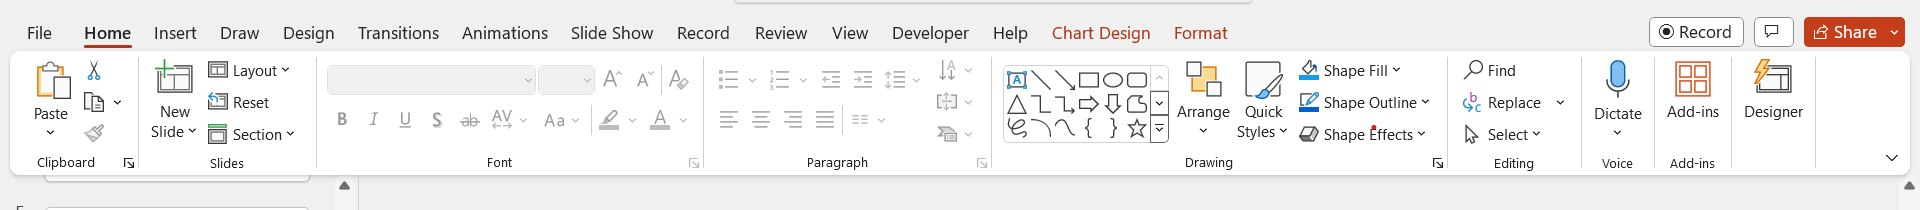
- Select the chart you want to customize or modify.
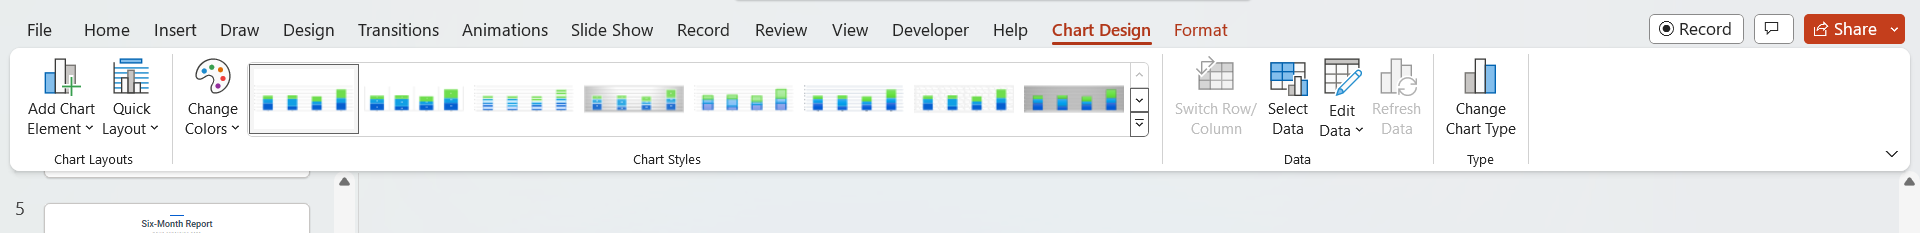
- You will see “Chart Design” and “Format” options appear in the top section.
- If you click the “Chart Design”, you will see “Edit data” option. You can click the “Edit Data” and start including your data in the excel.
Apart from this, you can also explore our other charts and graphs presentation templates for more options.