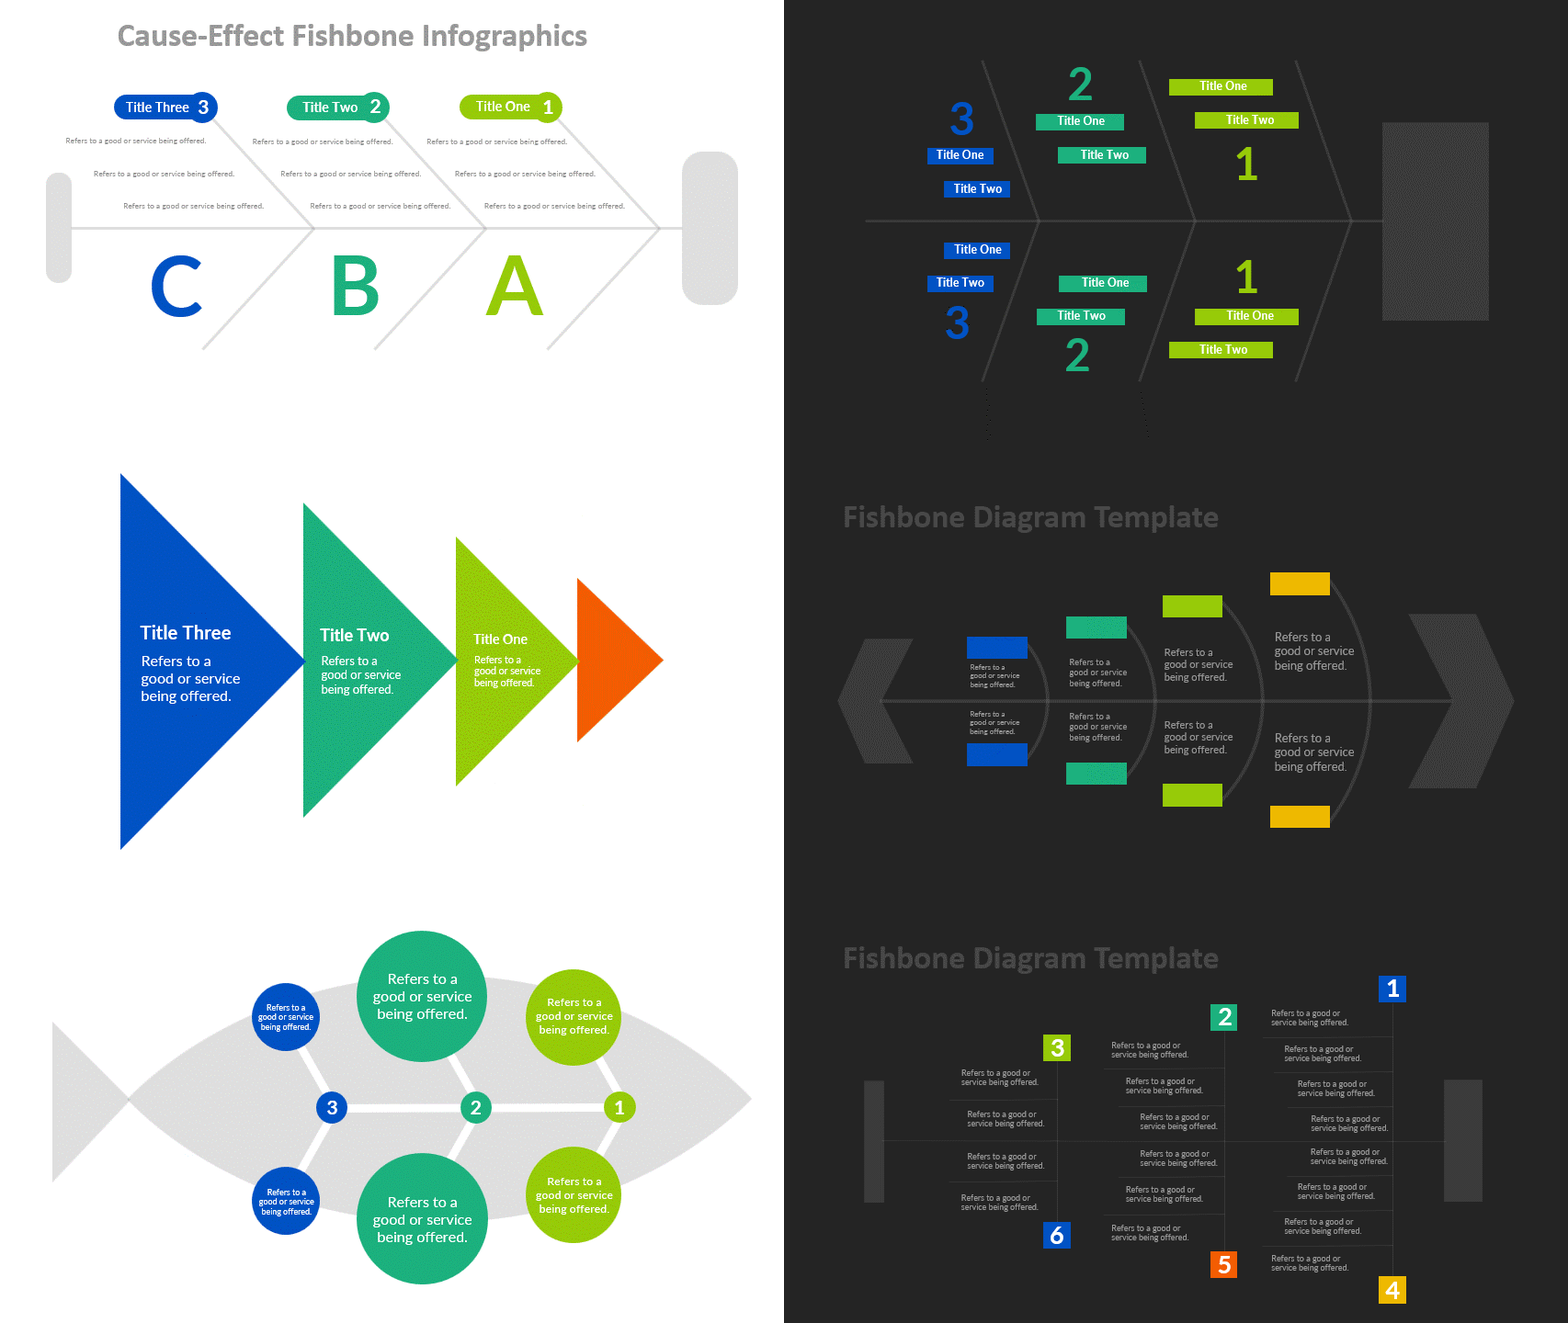
There might be situation where you are performing analysis or study of any scenario and you want to present your findings as “Cause-Effect”. Well in that case where you want to present – causes of a situation and effects thereof – you can make use of “Fishbone Diagrams”.
A fishbone diagram is a visual way to look at cause and effect. It is a more structured approach than some other tools available for brainstorming causes of a problem (e.g., the Five Whys tool). The problem or effect is displayed at the head or mouth of the fish.
This template comes with 13+ slide designs for Fishbone diagrams that is useful for business presentation, study and research presentation, social impact analysis presentation and more.
Fishbone diagrams are also known as “Ishikawa” Diagrams. You can use Ishikawa diagrams for following situations;
- When identifying possible causes for a problem
- When a team’s thinking tends to fall into ruts
Once you download this template, you will find following features;
- All designs and layouts are fully and easily editable (shape color, size, and text).
- This Ishikawa diagram and infographic template has a color theme and will automatically apply color when copied and pasted.
- Drag and drop text and image fields.
- Comes with vector icons, replaceable.
- Based on master slides
- The aspect ratio of 16:9
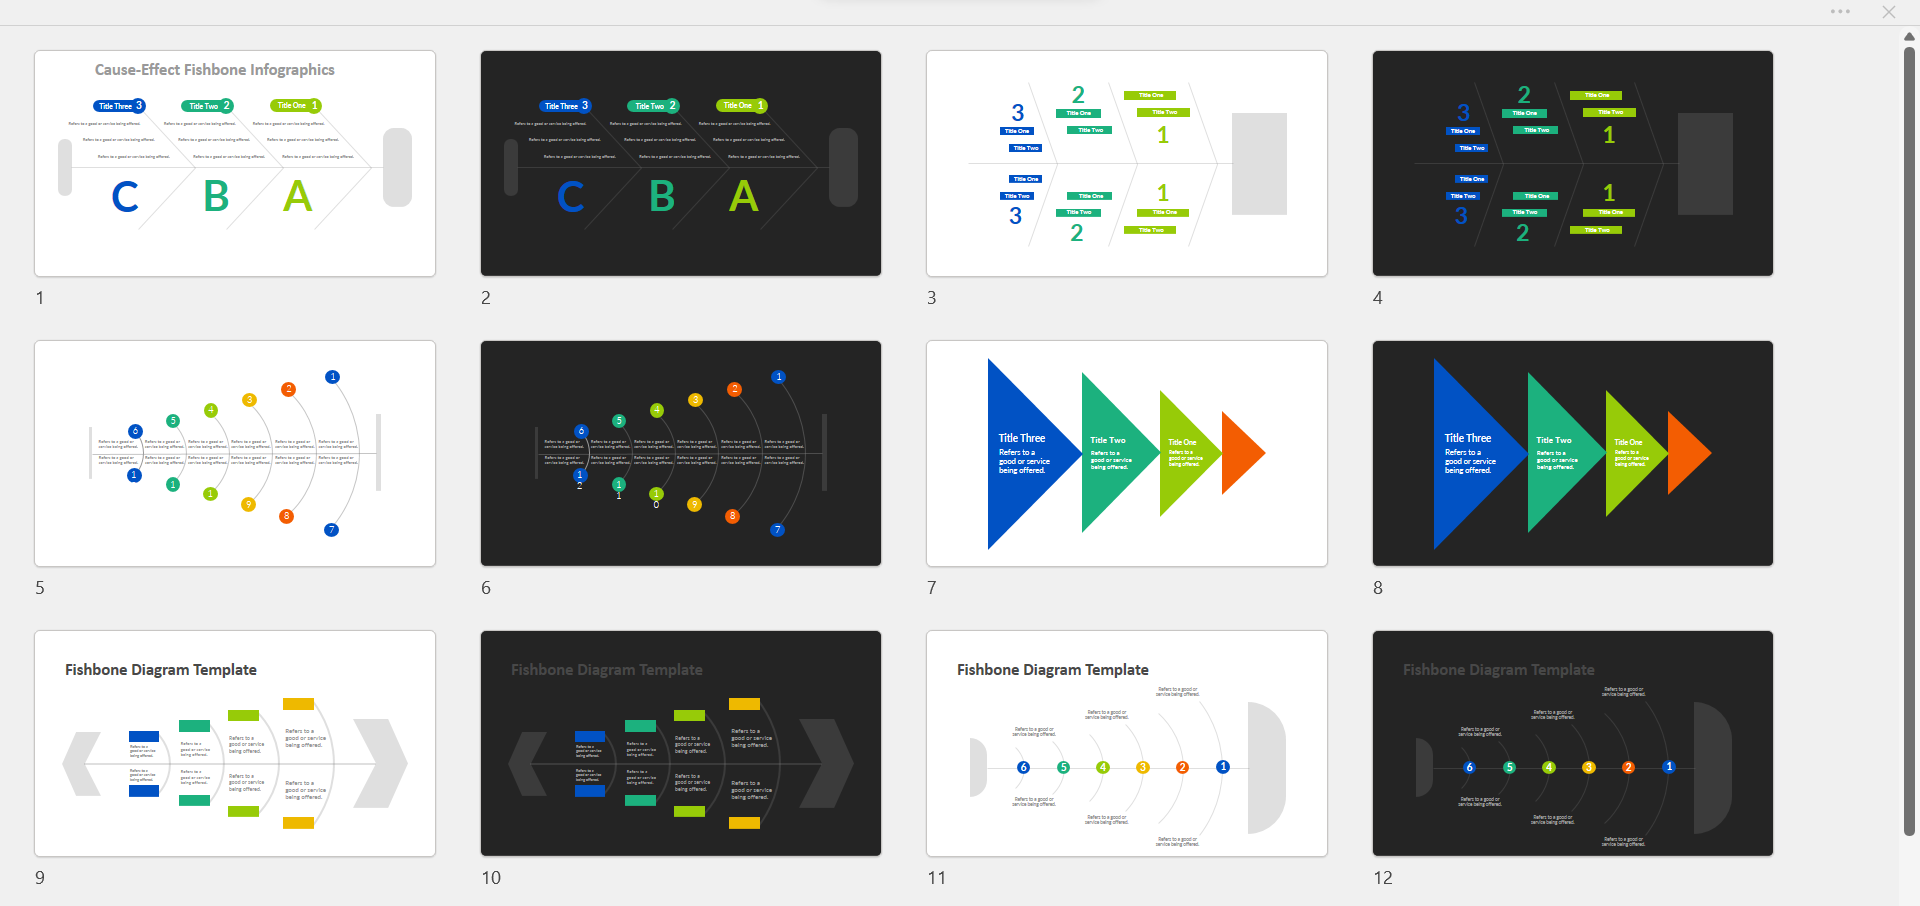
- It comes with 16 fishbone infographic slide designs for presentations.
- It comes with Keynote file which is compatible with Keynote.
- Collection of dark themed and light themed designs.
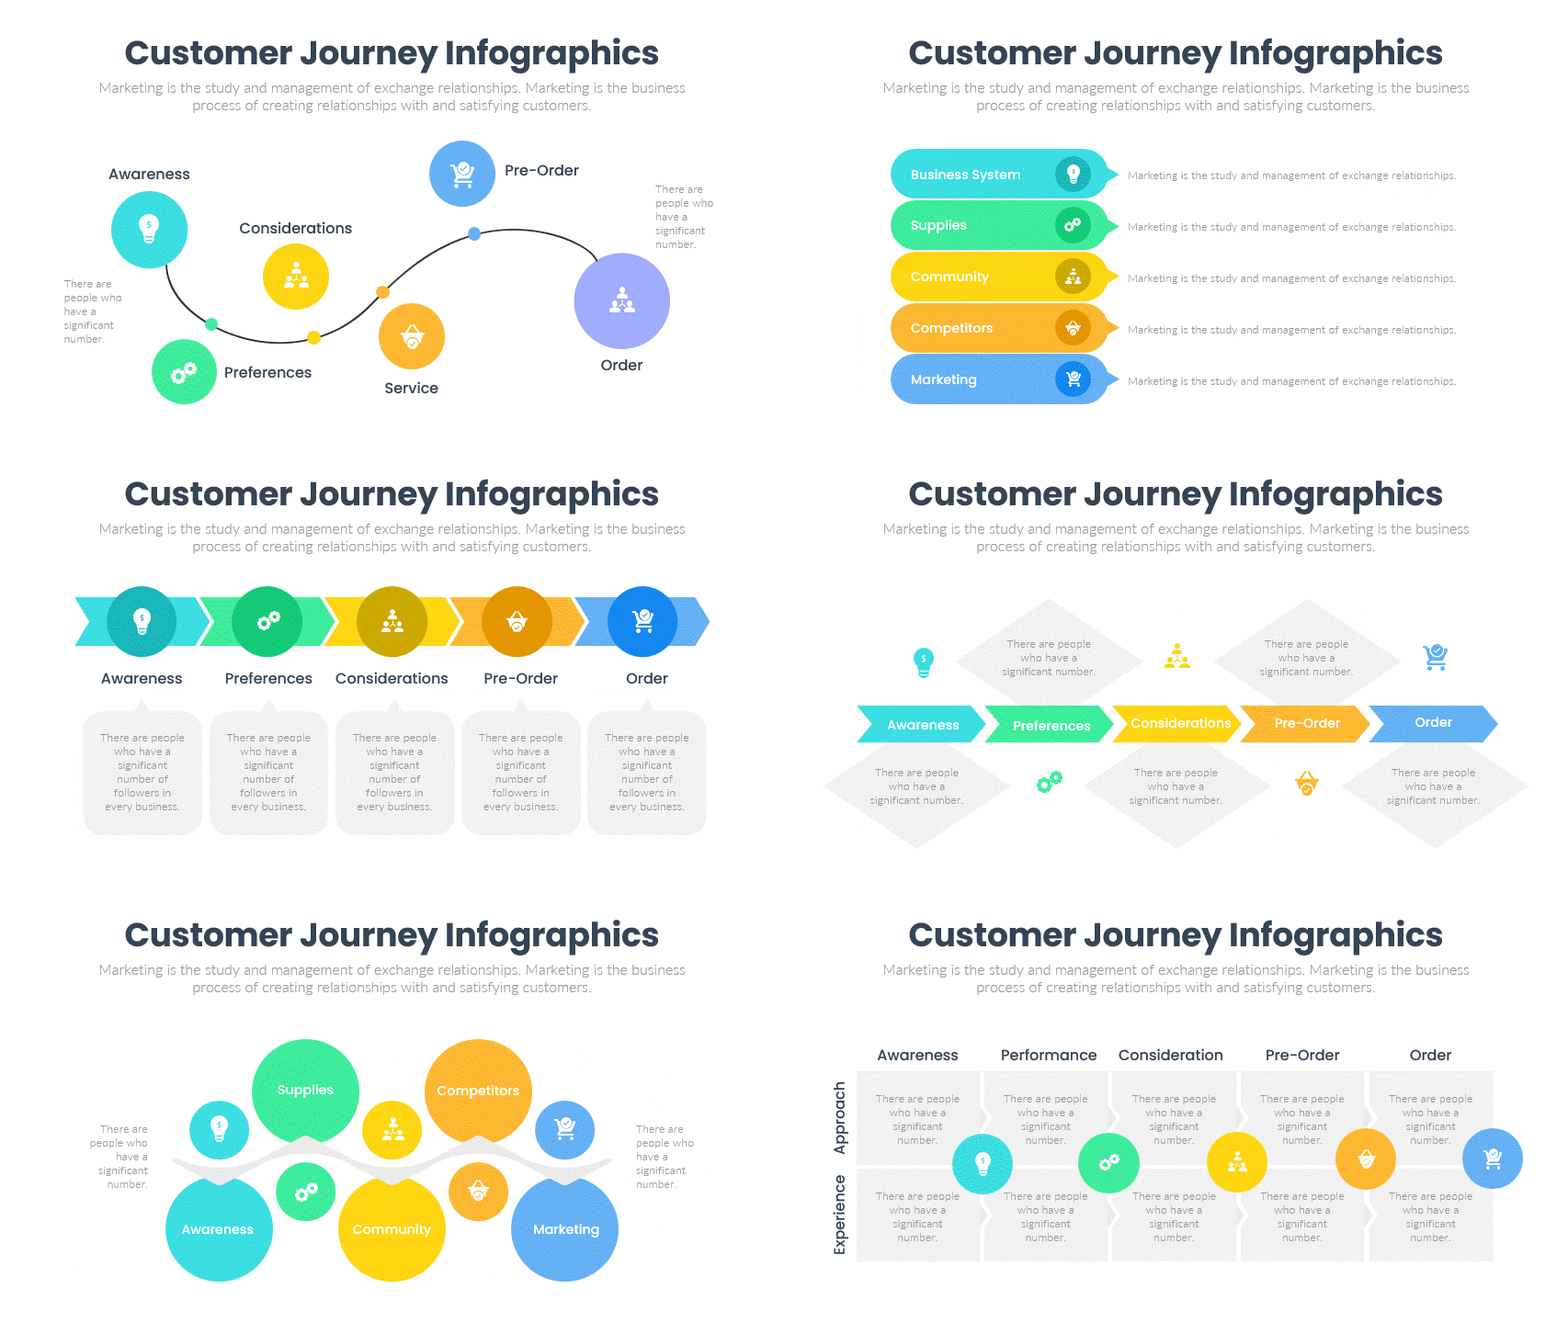
Below are the screenshot of the slides, that comes with this package. Explore and download all the resources and use / modify as per your requirement.
You can also explore other infographic slide designs to include in your presentations. If you want to learn more about Ishikawa Diagram and its usage, please refer this article from ASQ.org.
