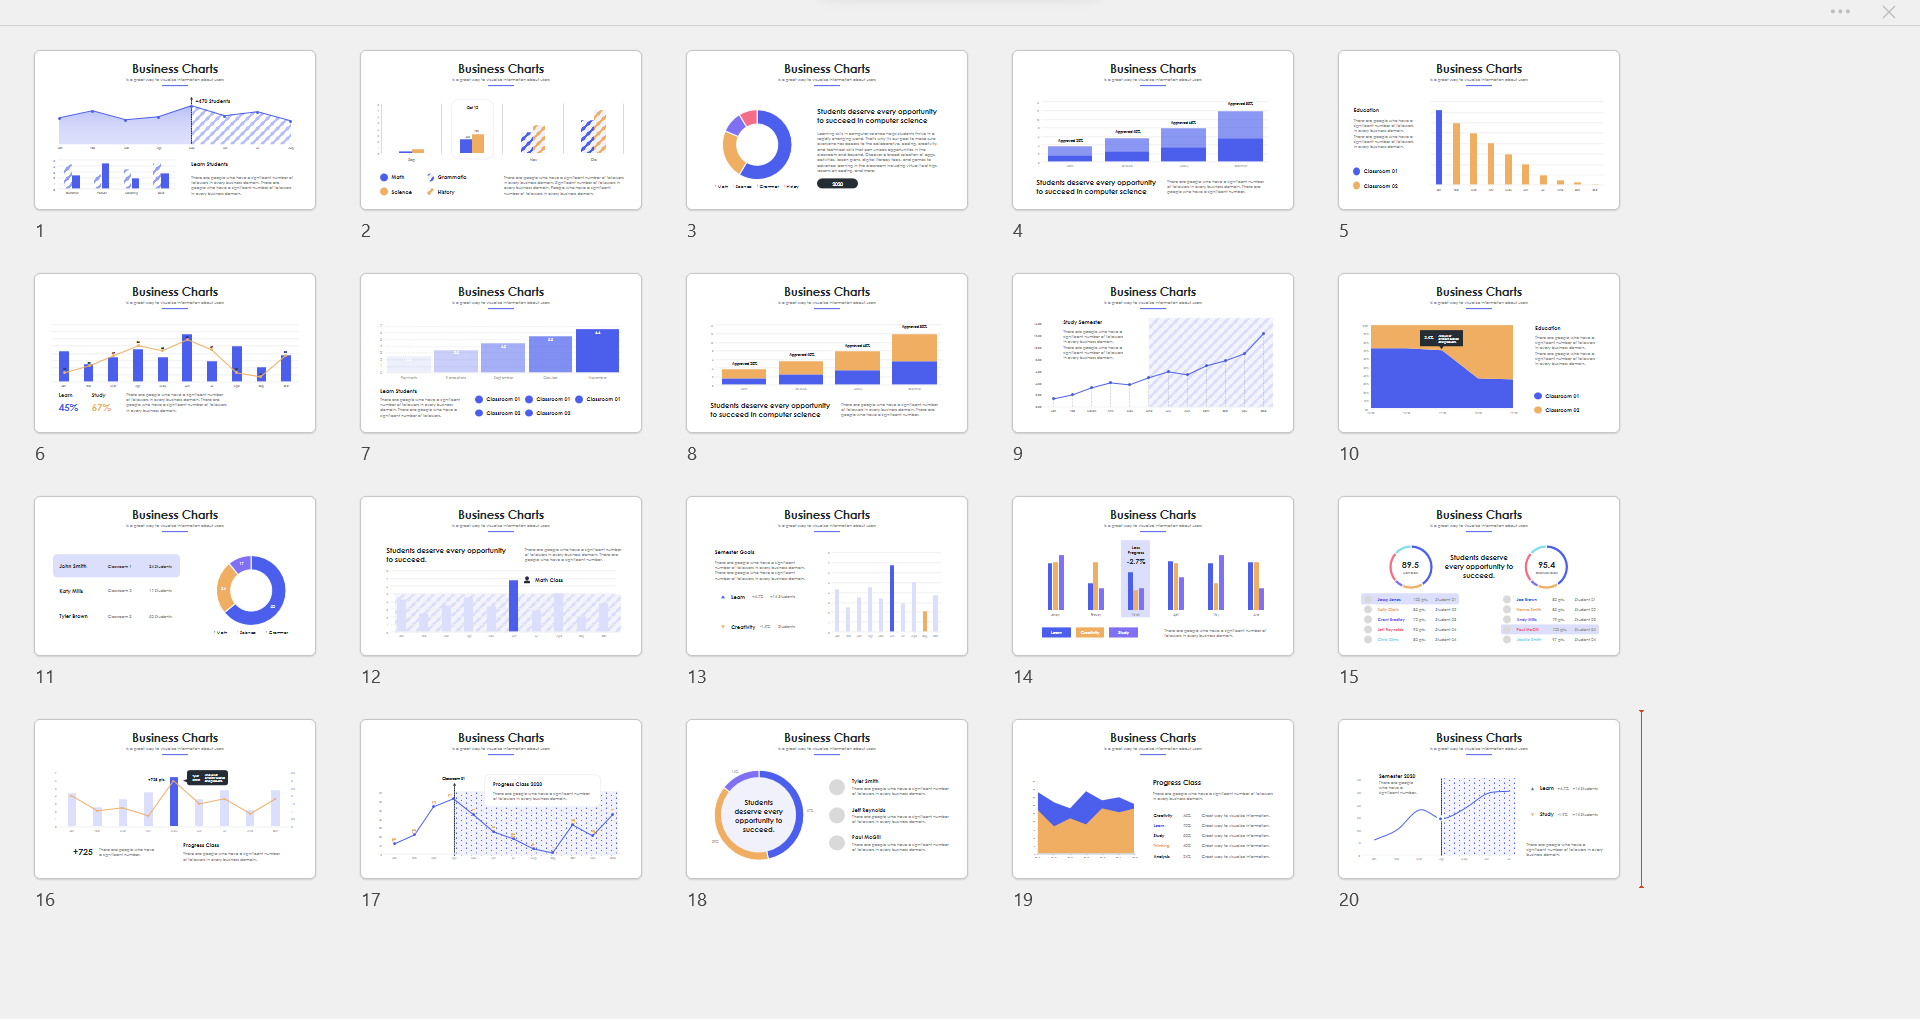
Charts and Graphs are essential part of business presentations. These are useful in showcasing datasets and data tables in a visually appealing designs. However, different charts and graphs have different utility. This is a collection of 20 such different slides, designs, formats and layouts comprising of;
- Donut Charts
- Line Graph
- Area Graph
- Histogram
- Bar Graph
- Pie Chart
Once you download this presentation infographic template collection for bar charts infographic slides, you will find following features:
- All designs and layouts are fully and easily editable (shape color, size, and text).
- This template has a color theme and will automatically apply color when copied and pasted.
- Drag and drop text and image fields.
- Comes with vector icons, replaceable.
- Based on master slides
- The aspect ratio of 16:9
- It comes with 20 business charts infographic slide designs for presentations.
- Comes with .key file which is compatible with Keynote.
You can also check out bar charts infographics, statistical analysis visualization slides and charts infographics by FormatWorks. Below are the screenshot of the slides, that comes with this package. Explore and download all the resources and use / modify as per your requirement.
You can create your own set of color codes when you implement these slides layout in your presentation.