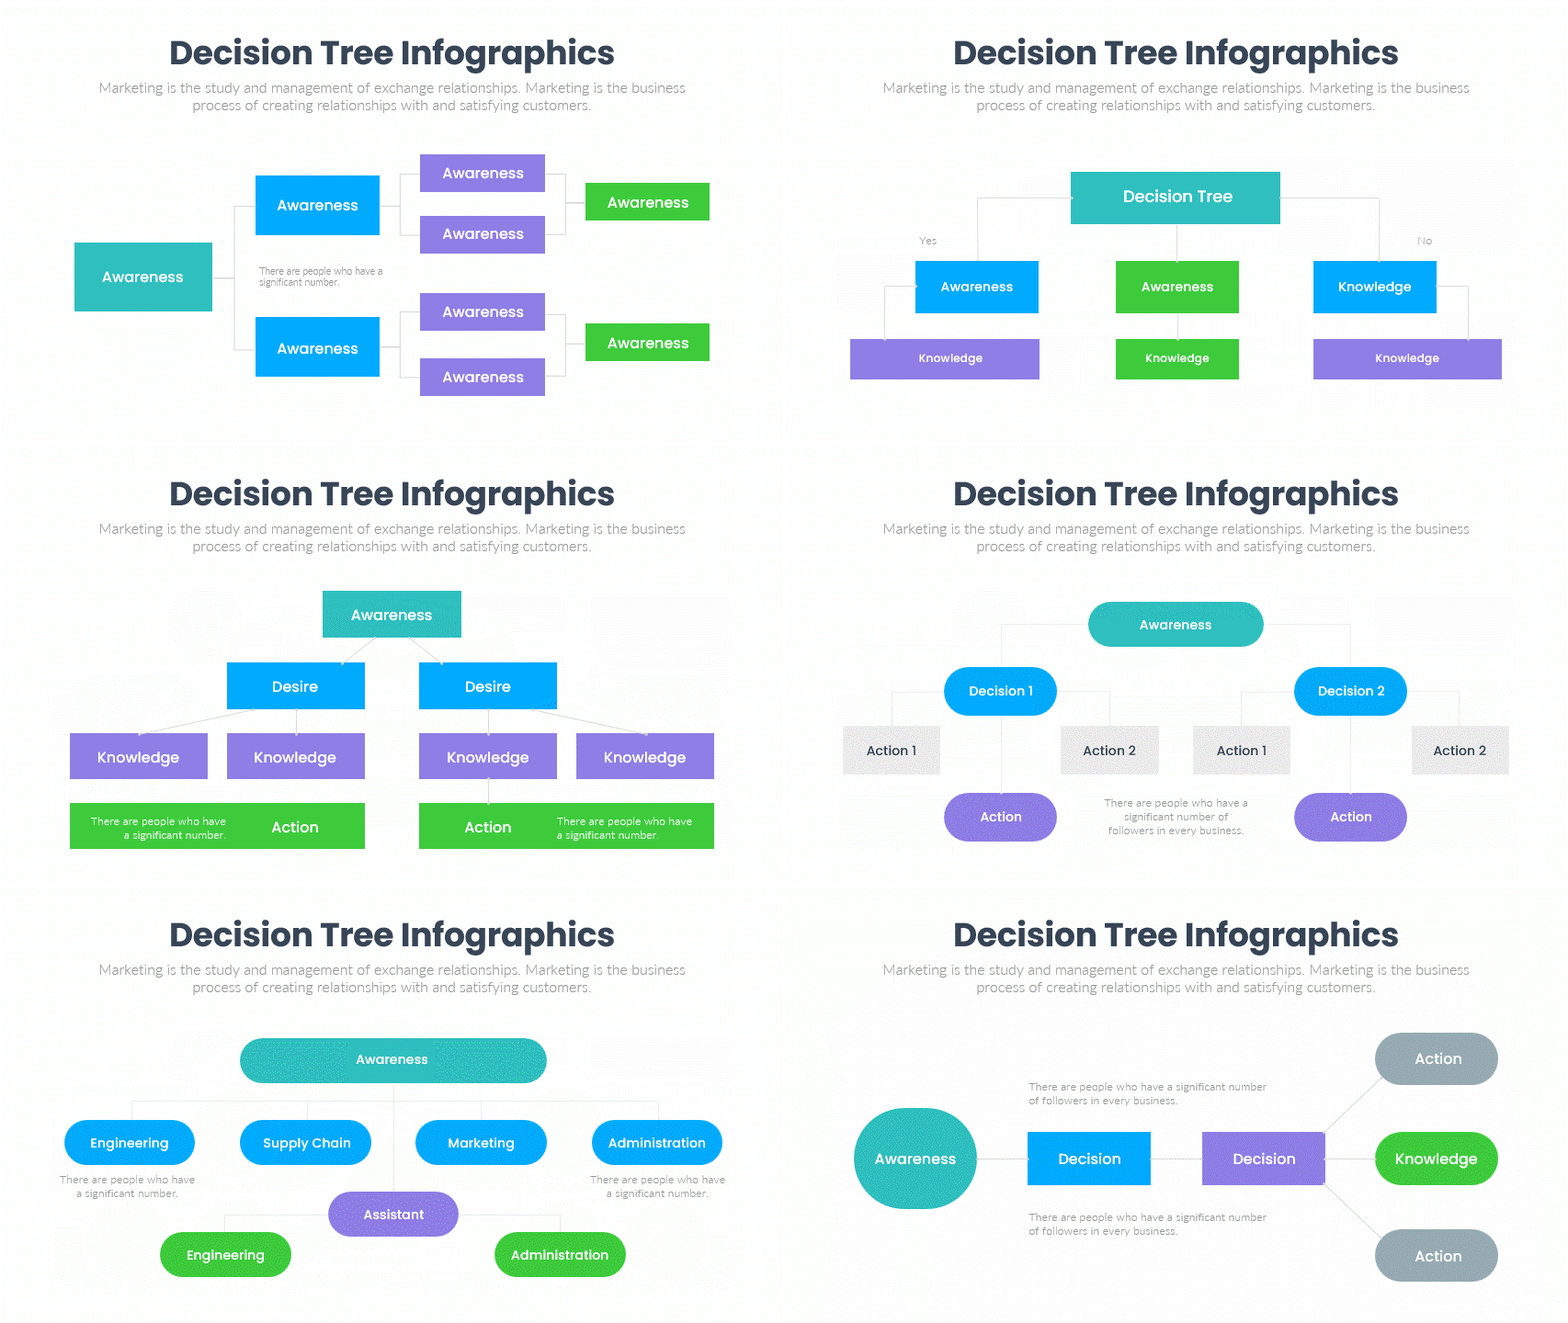
In simple language, decision tree diagram as the name suggests helps with decision making process. It breaks down the different paths of action available. It also somehow shows possible paths with each path of action.
In programming or be it business, decision trees are very helpful. You will require decision trees to write your program, product functionality, customer journey in your business or portal, visualize your business process etc. Hence, decision trees are used for both classification and regression tasks. It has a hierarchical, tree structure, which consists of a root node, branches, internal nodes and leaf nodes. These are technical jargons in a decision tree.
This is a collection of 24 decision tree infographics useful for presentations. These can be used for handling non-linear data sets effectively. These are useful in areas, such as engineering, civil planning, law, and business. You can also use these designs for categorizing employees in the office as well as hierarchy.
Elevate your information delivery capability in your presentation with the help of Infographic Designs.
- All designs and layouts are fully and easily editable (shape color, size, and text).
- This template has a color theme and will automatically apply color when copied and pasted.
- Drag and drop text and image fields.
- Comes with vector icons, replaceable.
- Based on master slides
- The aspect ratio of 16:9
- Editable data fields via Embedded Excel
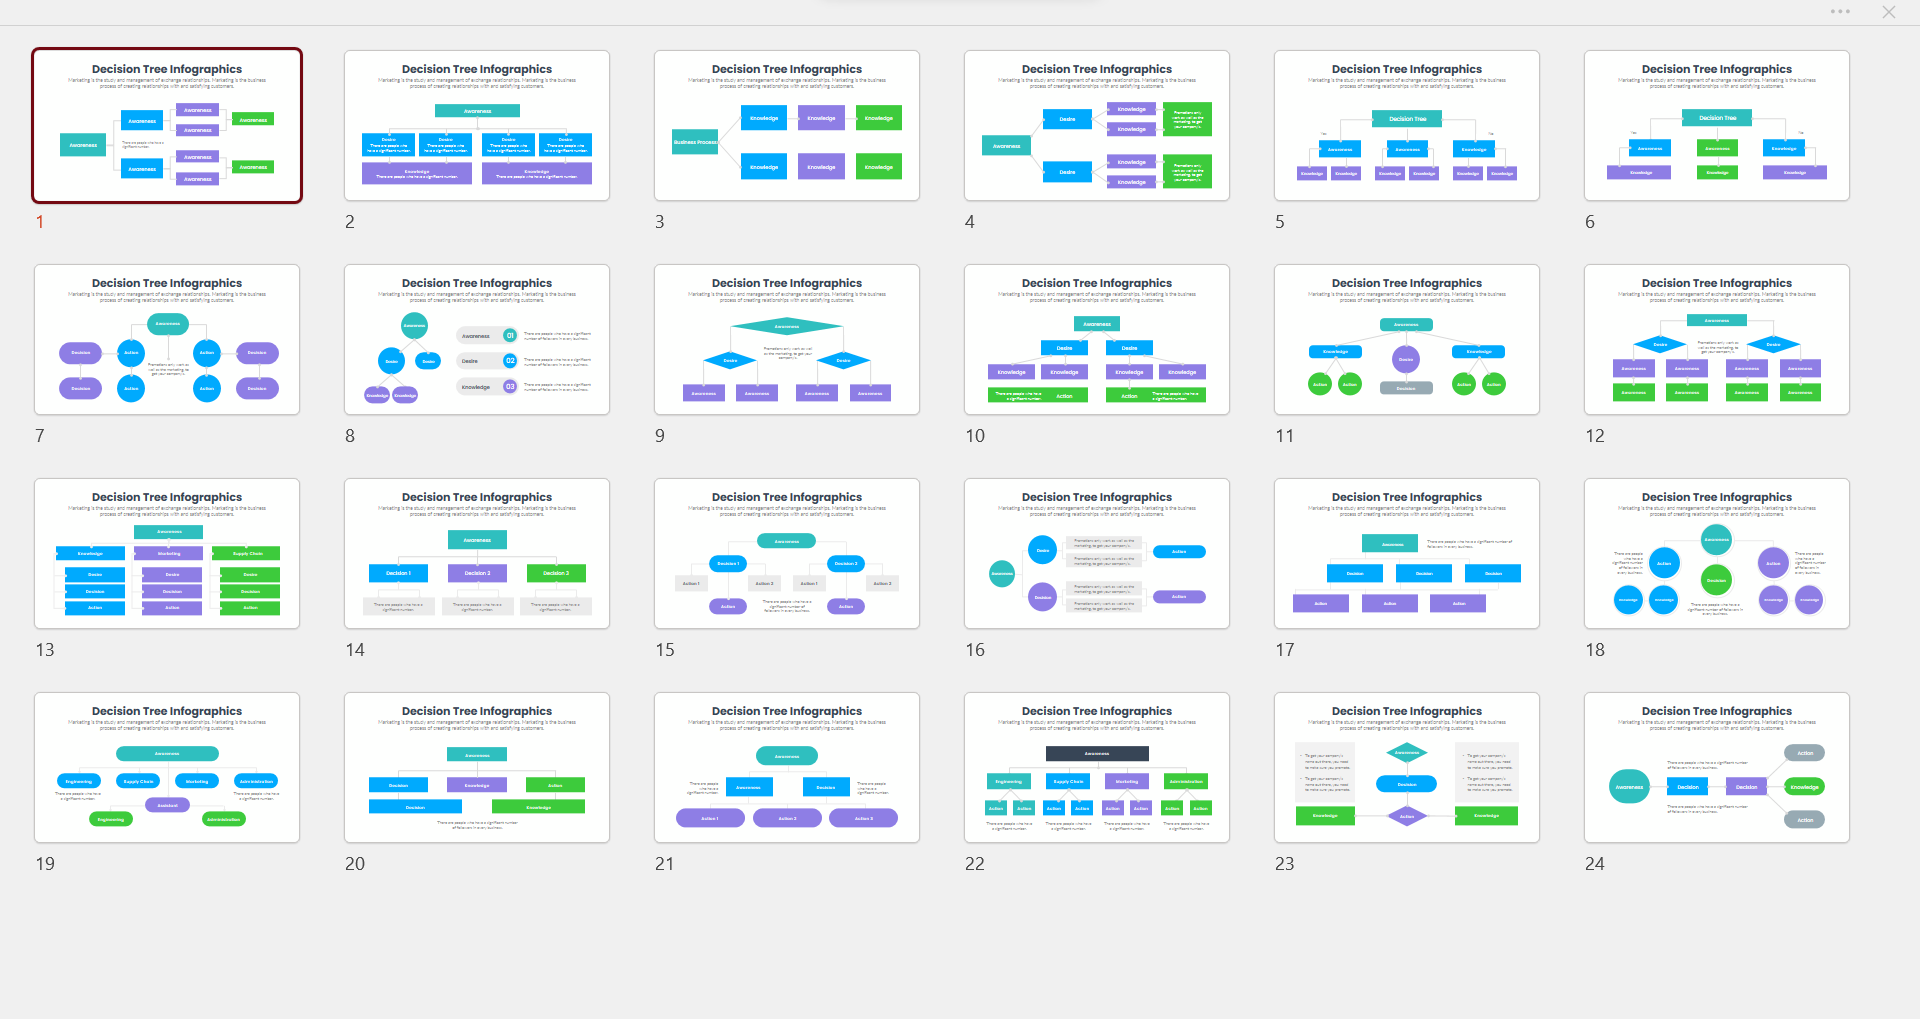
- It comes with 24 Decision Tree Infographic slide designs for presentations.
- Keynote file (.key) available with the package that is compatible with Keynote.
Below are the screenshot of the slides, that comes with this package. Explore and download all the resources and use / modify as per your requirement.
Modify the color scheme and color codes as per your requirement. Also, explore competitive advantage infographics that can be useful for your presentations.
